


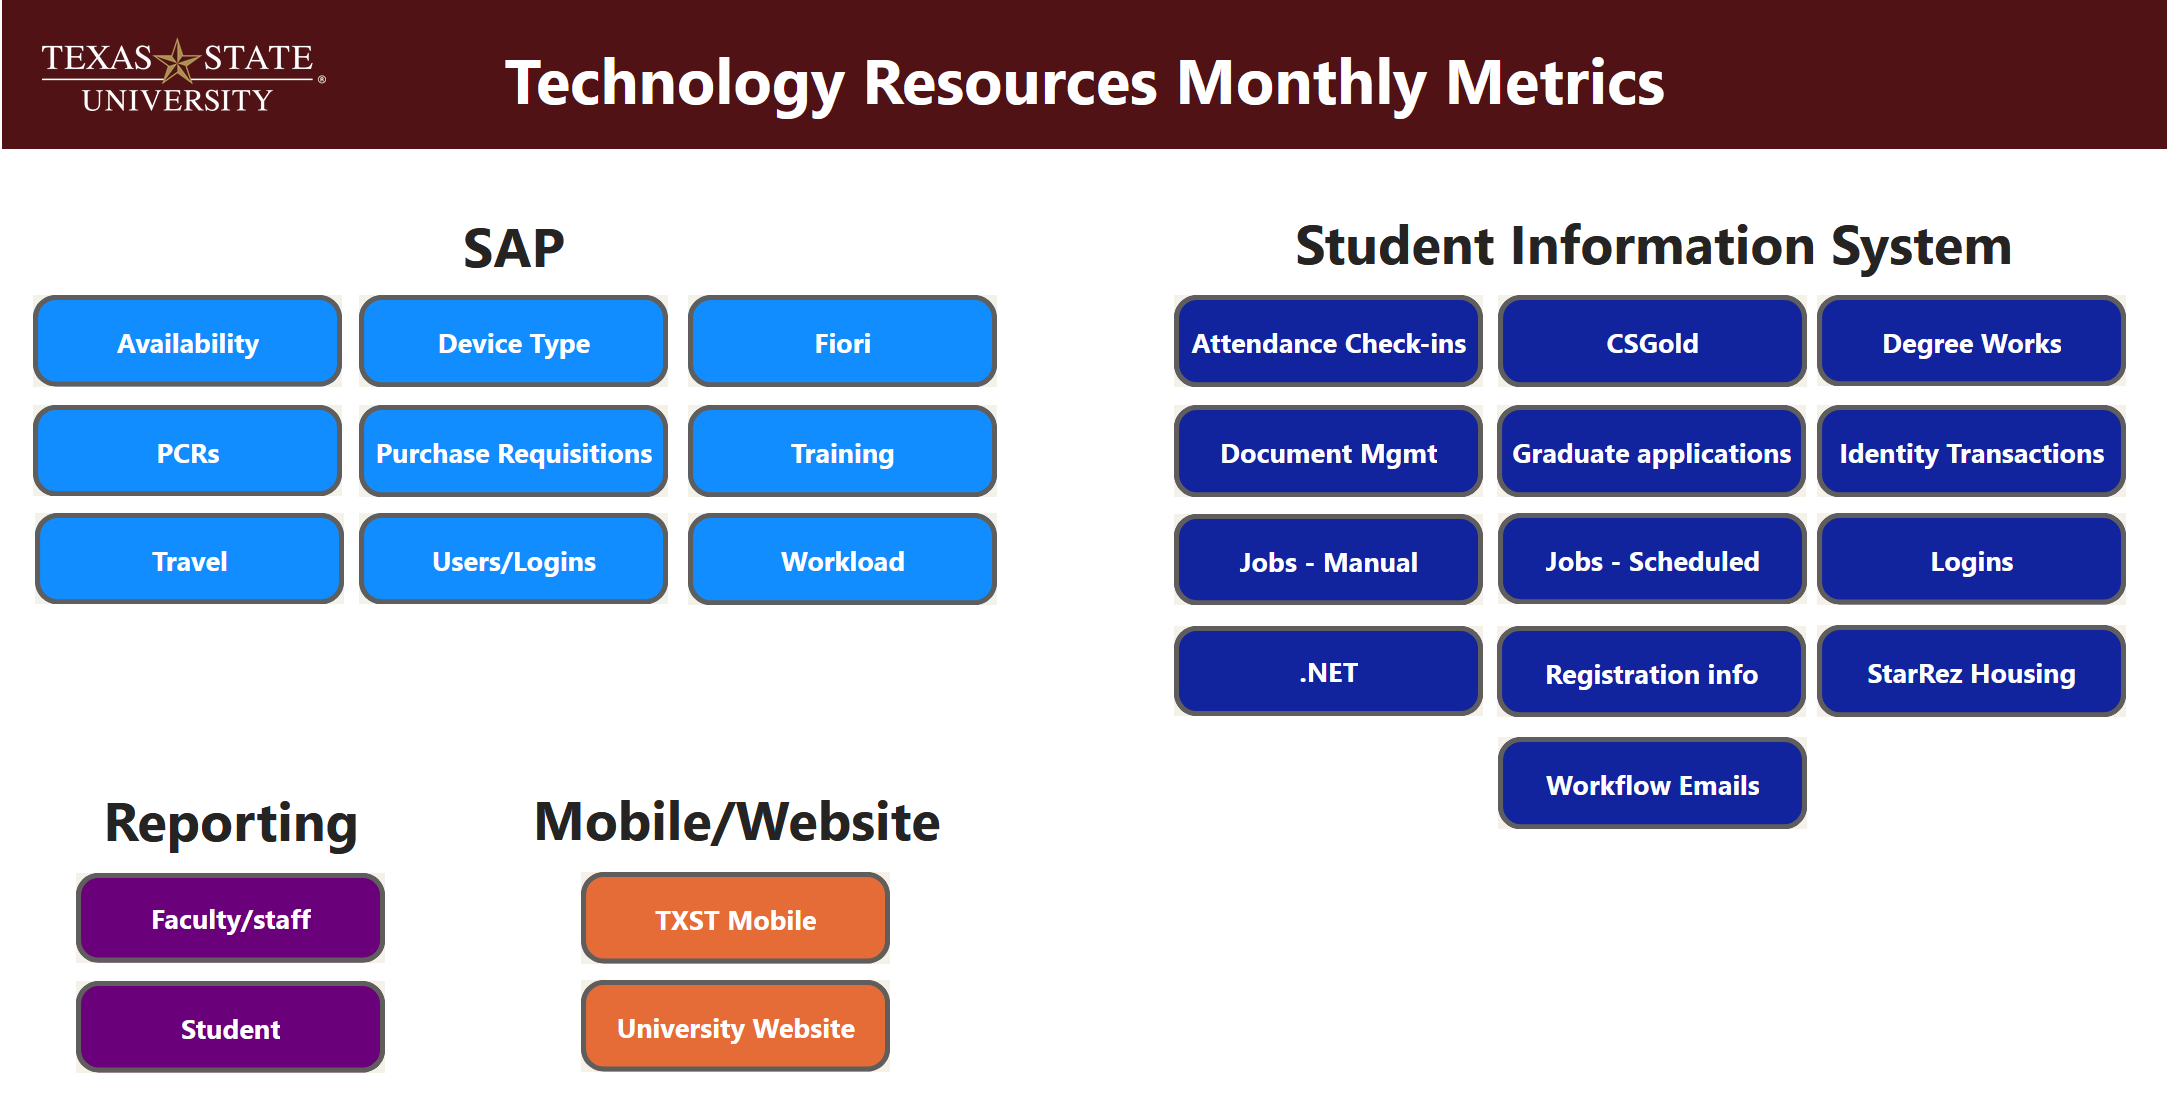
Technology Resources Monthly Metrics
Description: View a variety of metrics from applications Technology Resources manages. From the TXST Mobile App to SAP, this dashboard has all the information you need.
Updated: Monthly
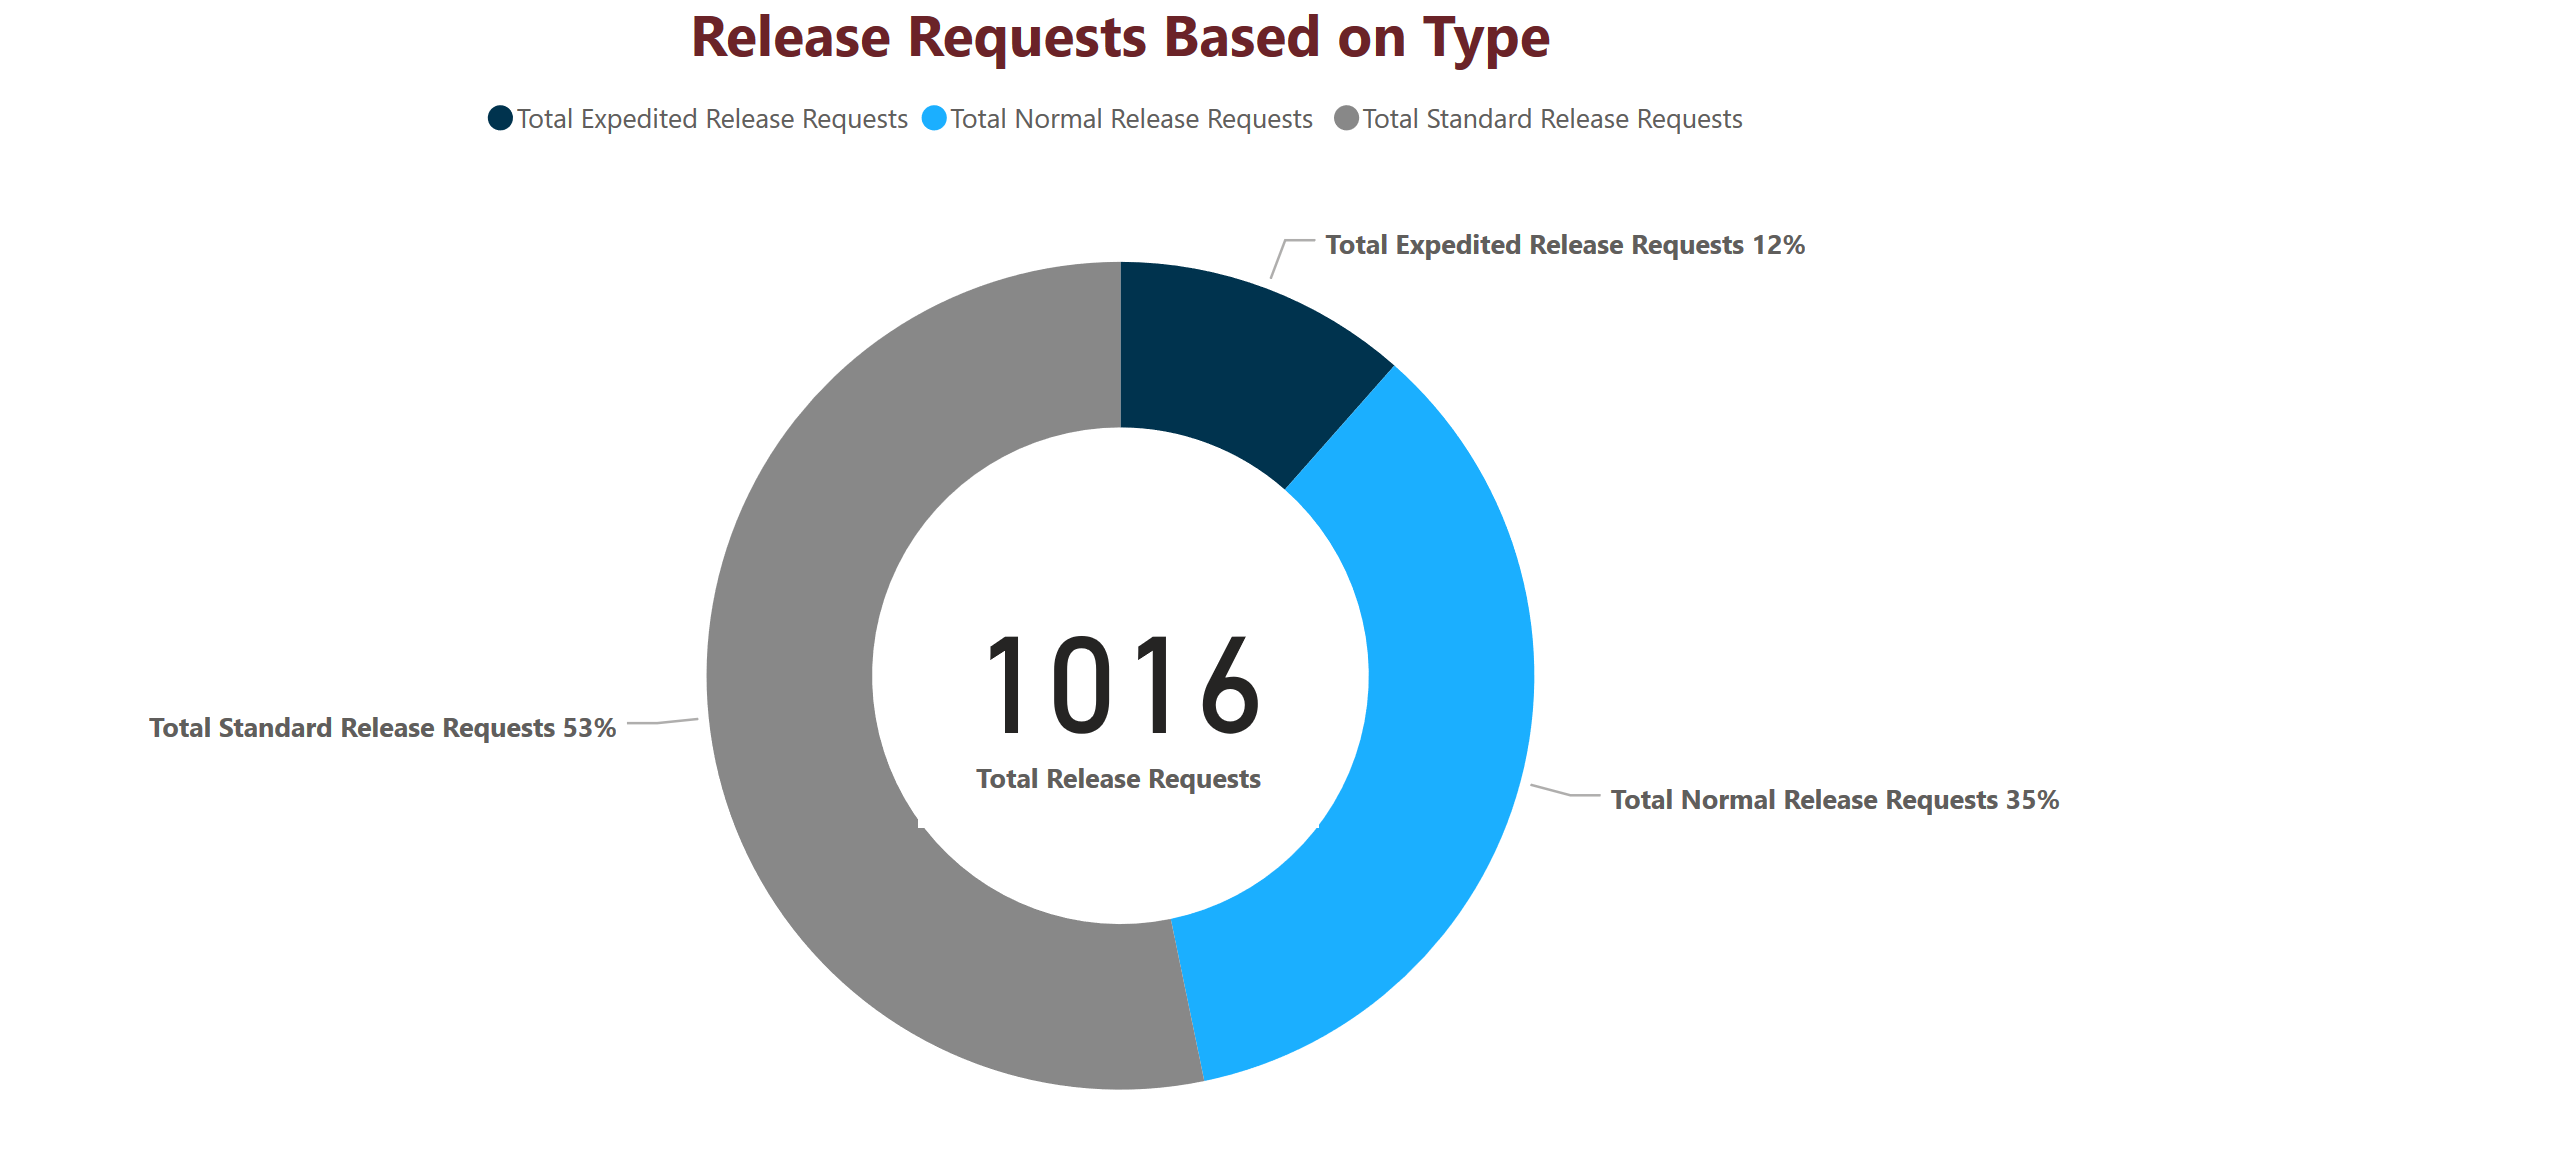
Change Management Metrics
Description: The Division of Information Technology adheres to strict change management policies and we pride ourselves in our change management, communication, and approval procedures. This dashboard displays the total number of year-to-date release requests and the average time taken to approve those requests in the system.
Updated: Weekly
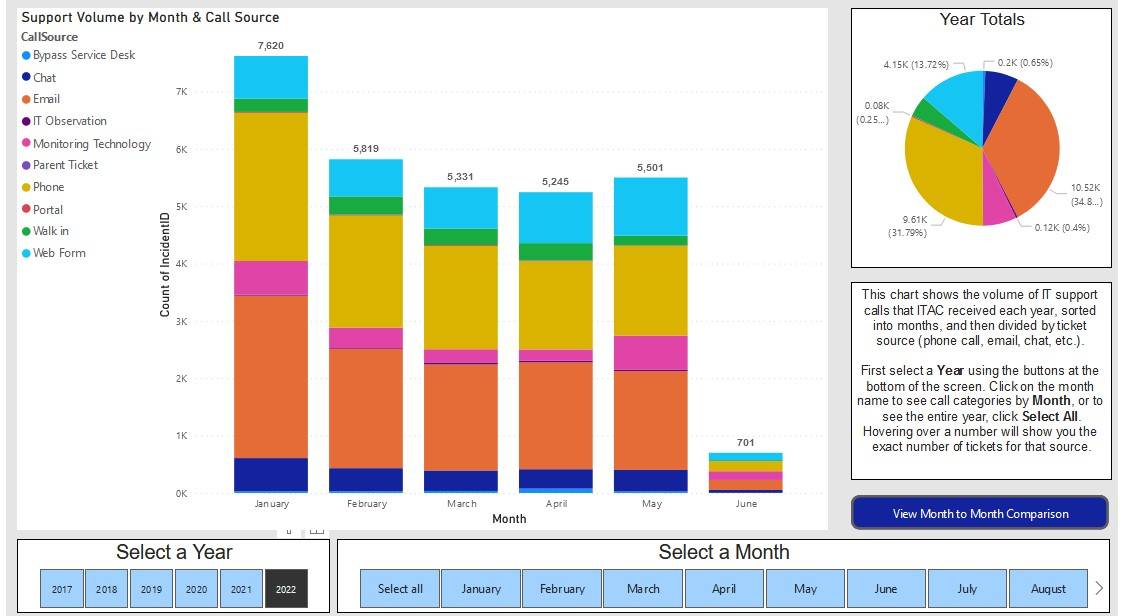
ITAC Support Volume
Description: Displays the volume of IT support calls ITAC received per year, sorted by month, and divided by the ticket source (phone call, email, chat, etc.)
Updated: Daily
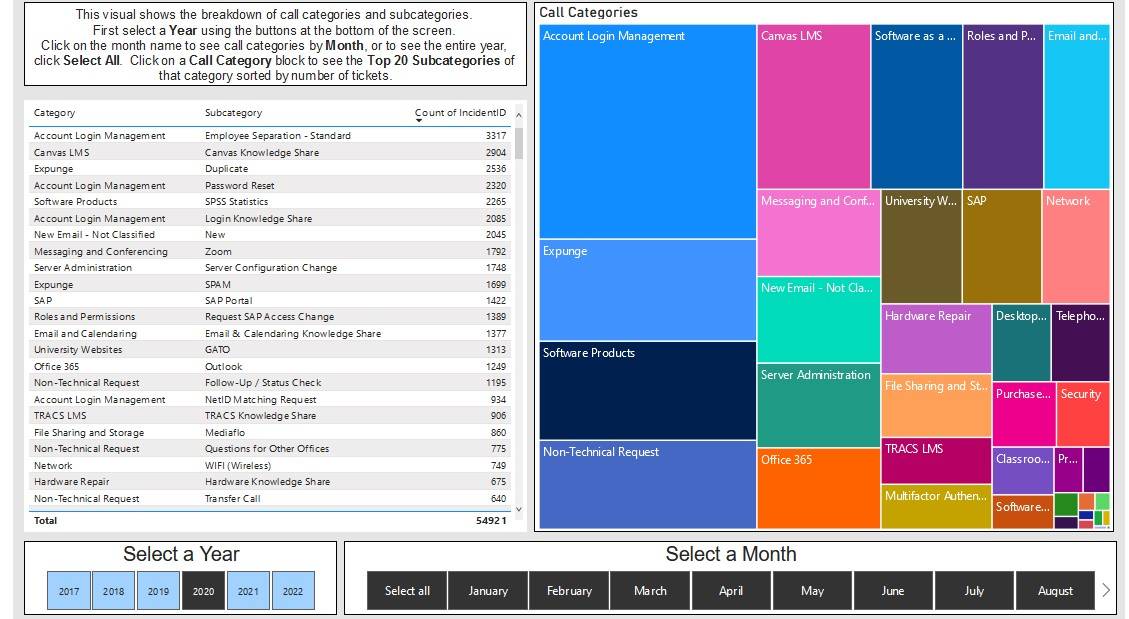
ITAC Call Categories
Description: Displays the breakdown of call categories and subcategories such as Canvas, Network, Office 365, etc.
Updated: Daily
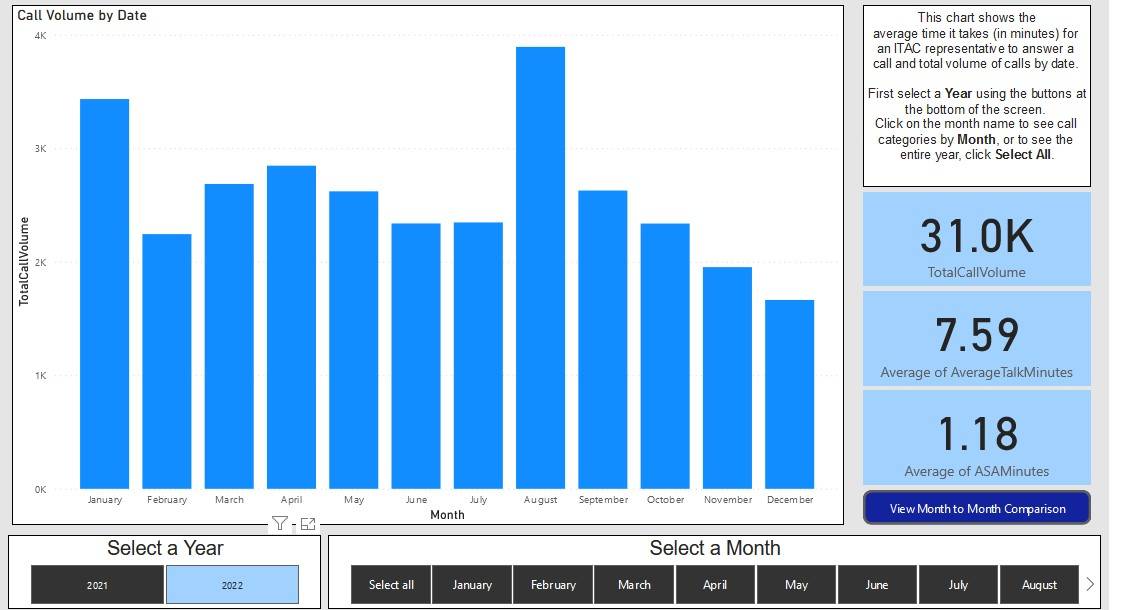
ITAC Call Volume and Average Wait Time
Description: Displays the volume and average call wait time by month.
Updated: Daily
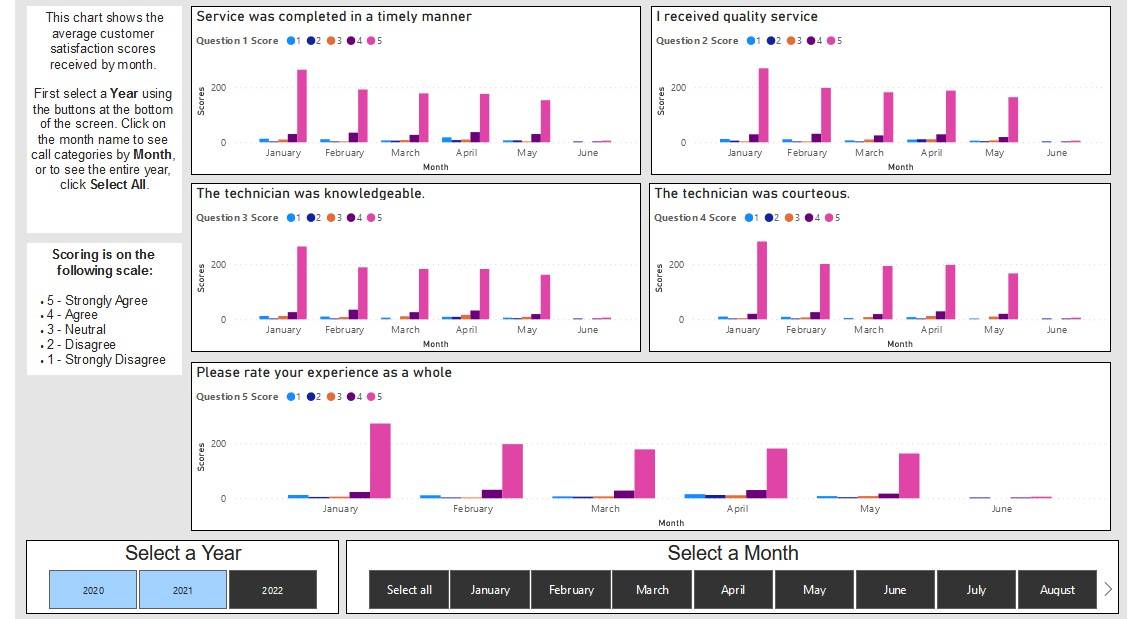
ITAC Customer Satisfaction Scores
Description: Displays the average customer satisfaction scores received by month.
Updated: Daily
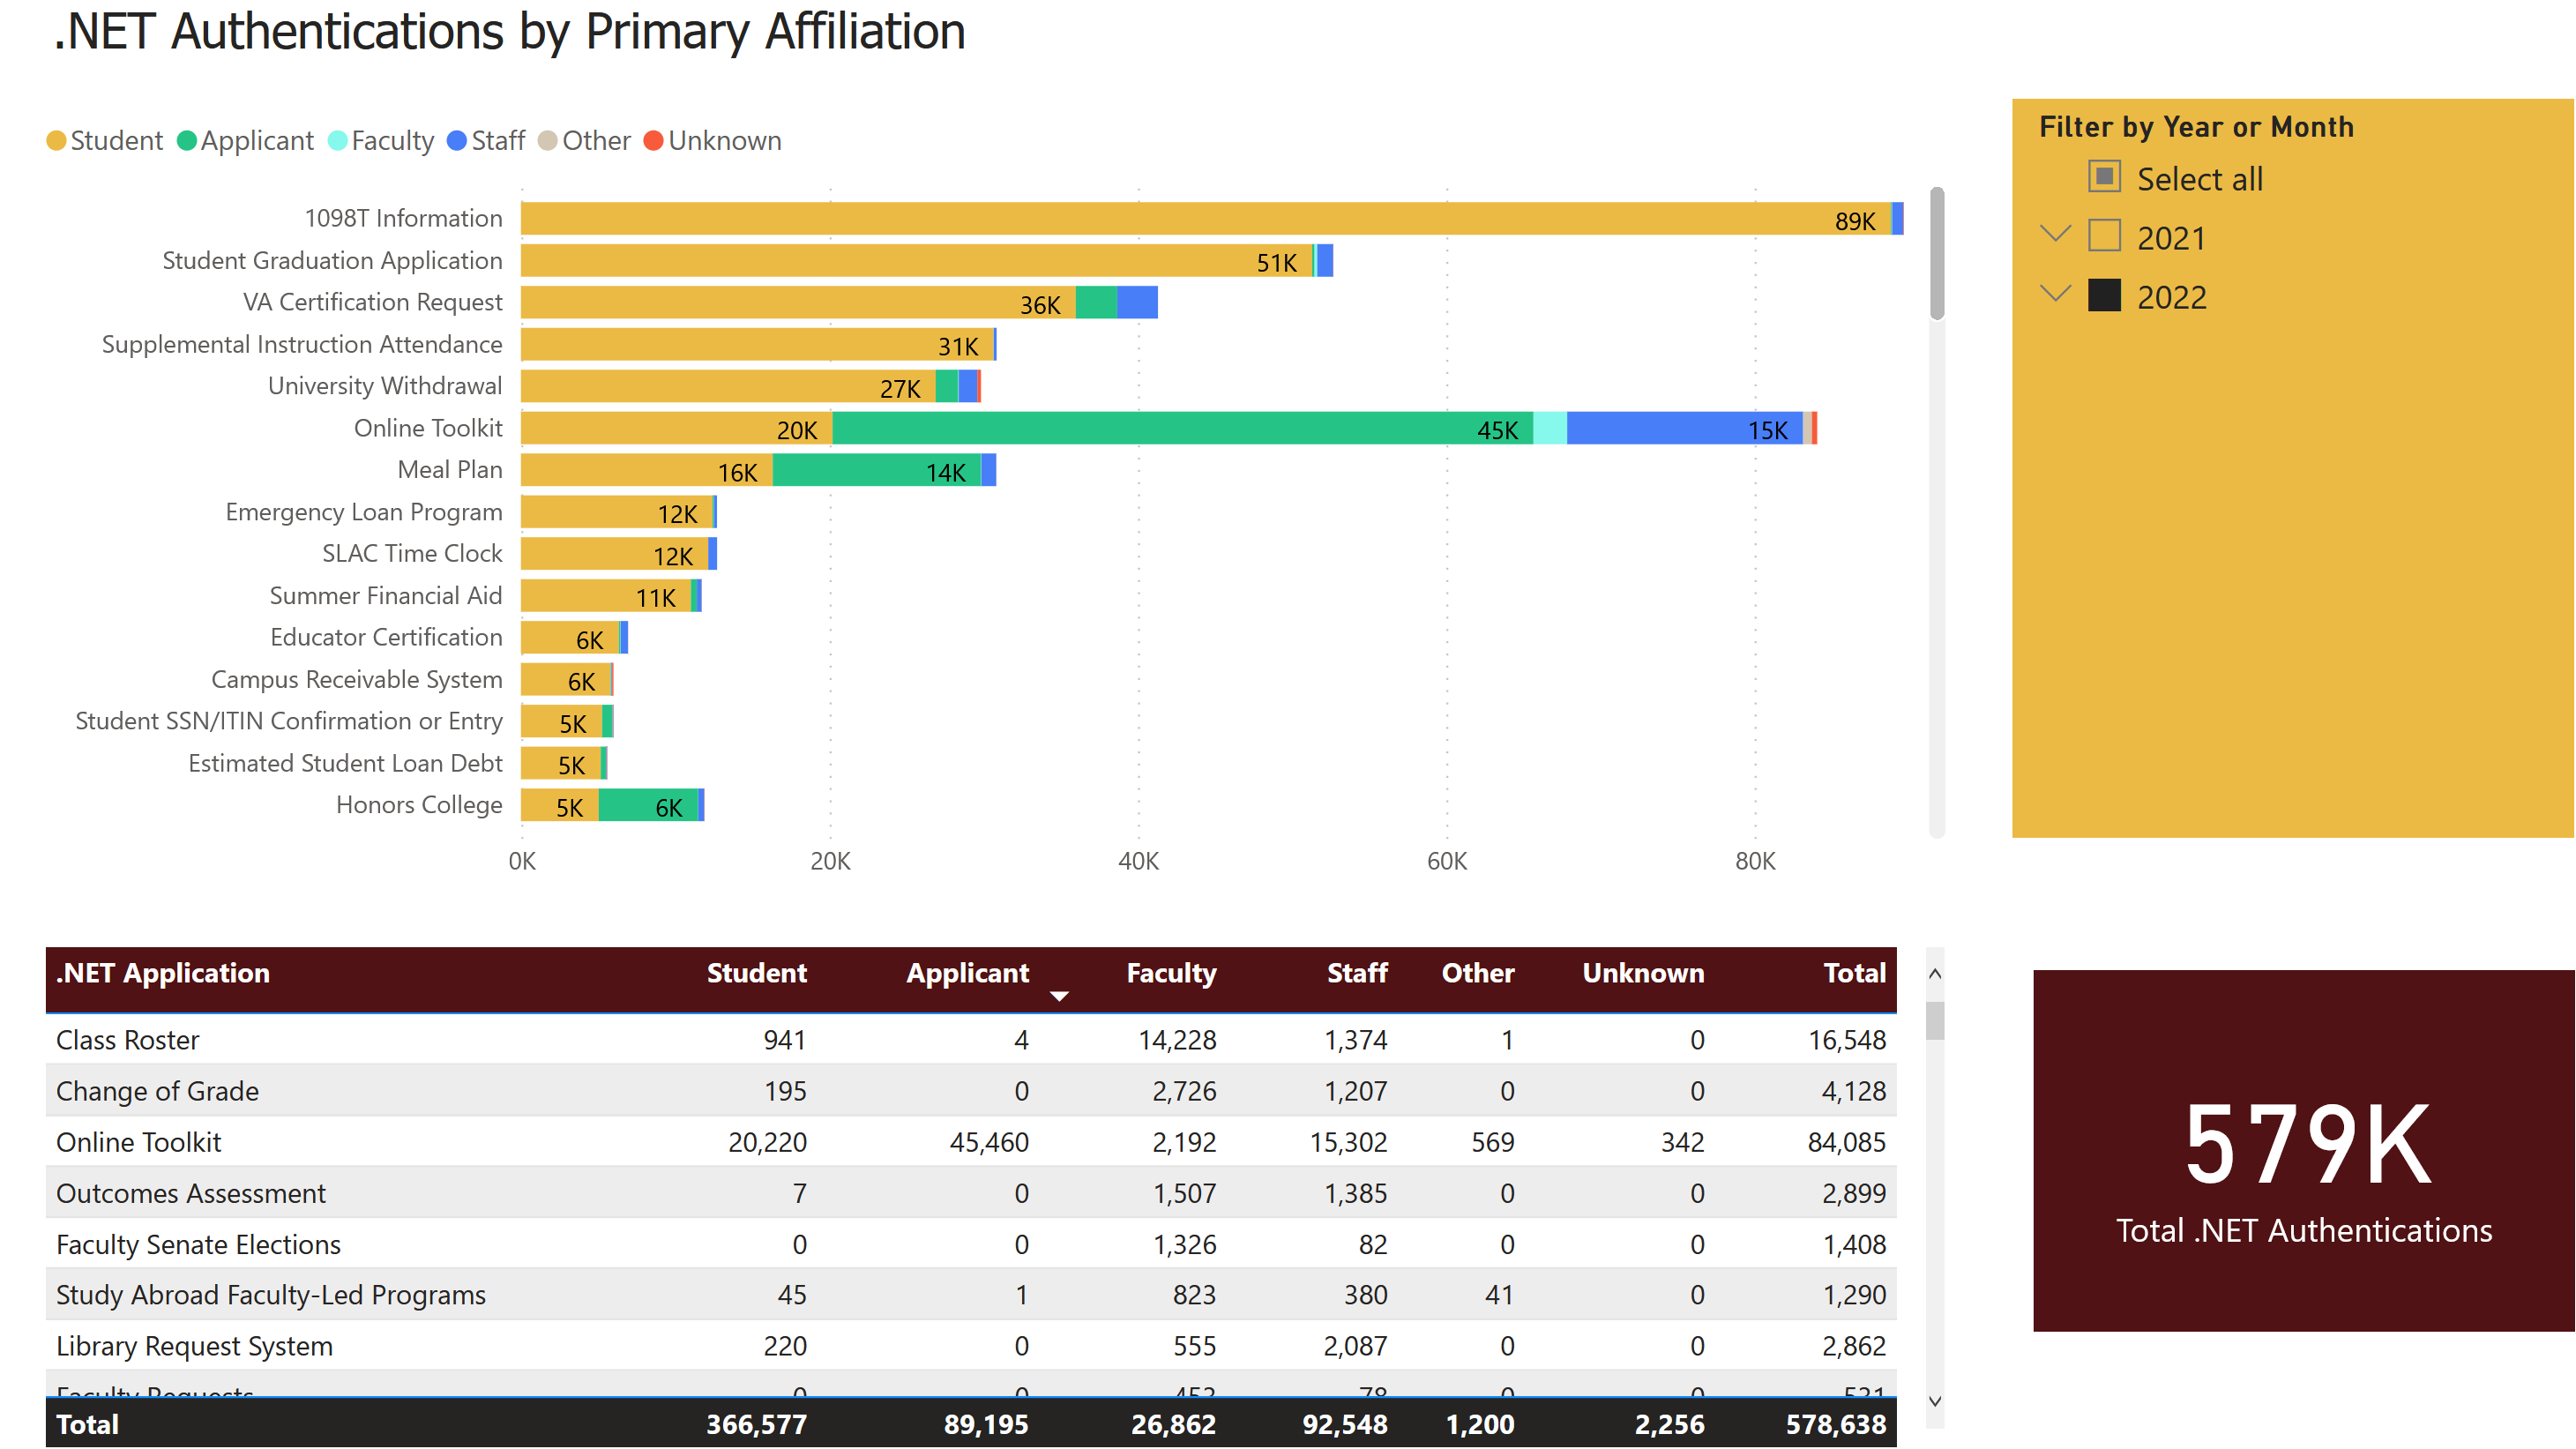
.NET Authentications by University Affiliation
Description: More than seventy .NET web applications have been developed to provide services for the university. This dashboard displays the number of authentications into each .NET application based on the person’s TXST primary affiliation (Student, Applicant, Faculty, Staff, etc.). The dashboard can be filtered by specific years or months to view seasonal differences in utilization.
Updated: Monthly
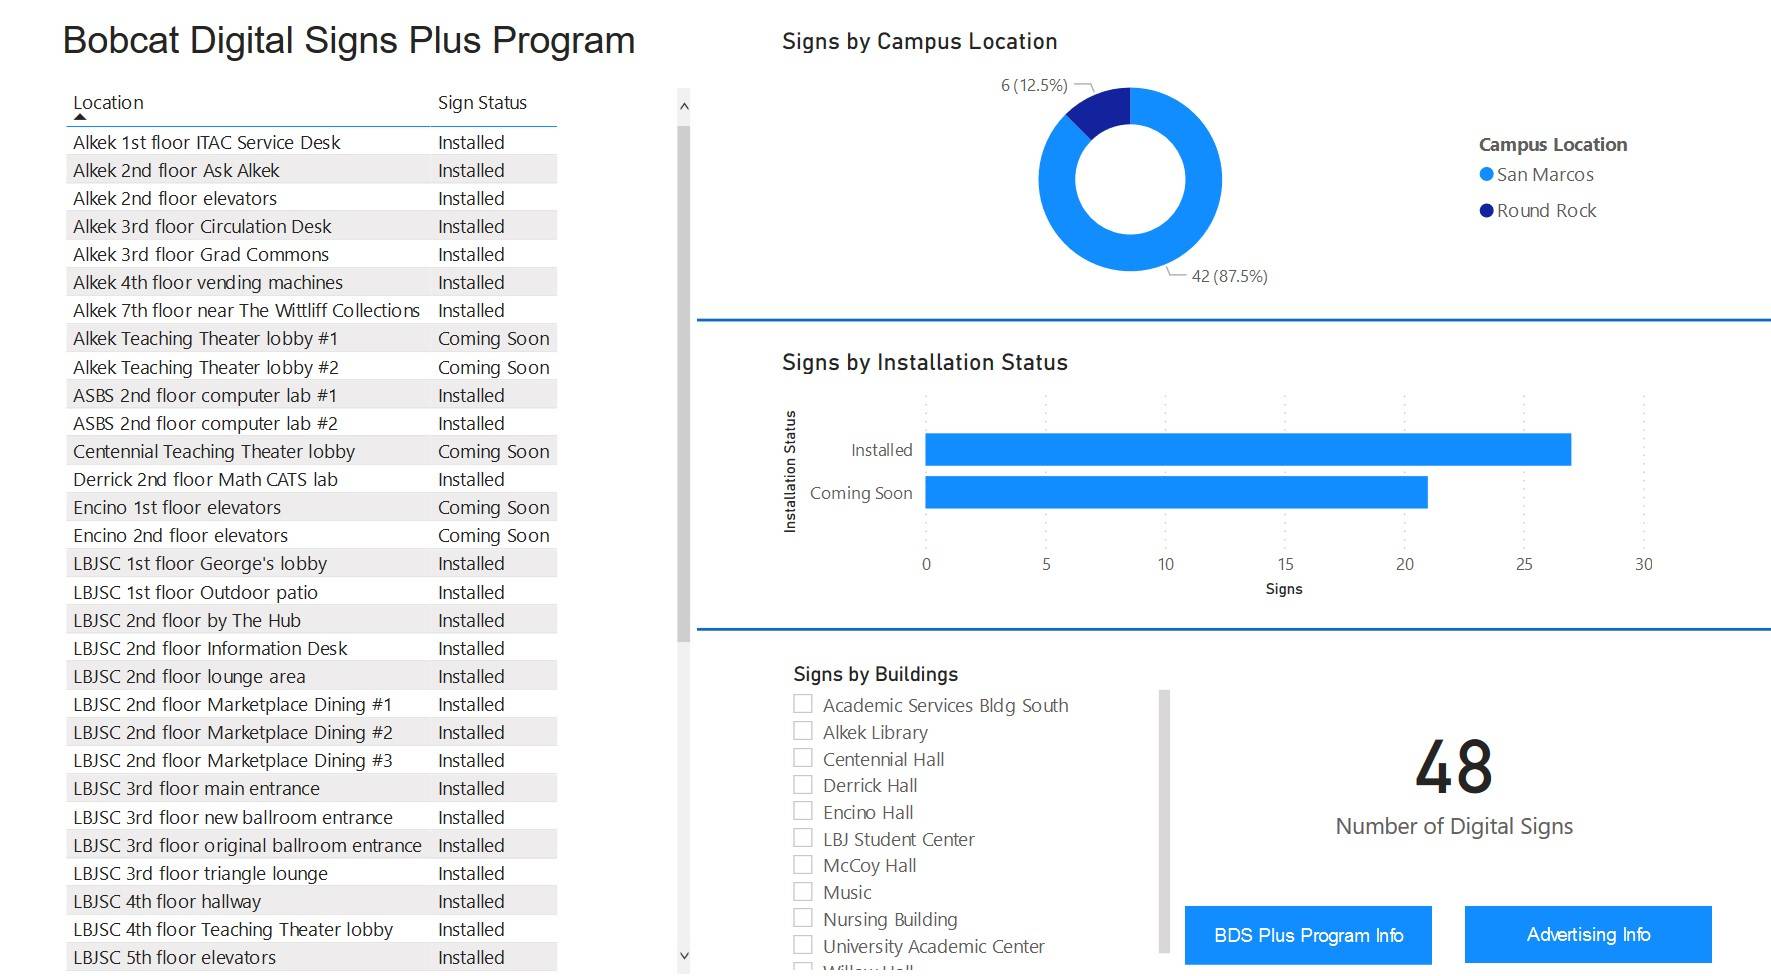
Bobcat Digital Signs
Description: Bobcat Digital Signs, the digital sign solution for the university, is quickly becoming a sought-after service on campus. The usage, roll-out, display location, and display installation status can all be tracked using this dashboard.
Updated: Monthly.